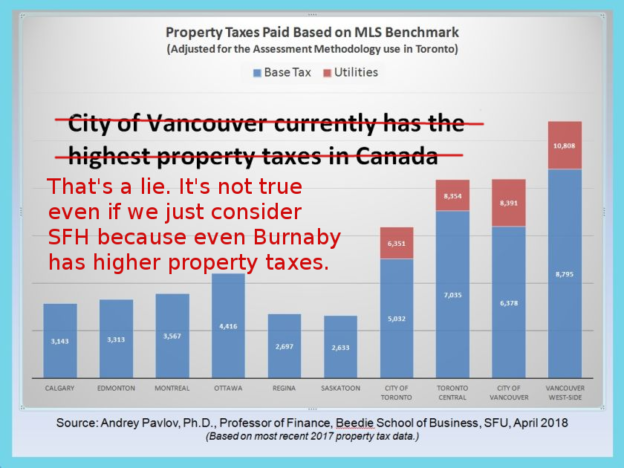
Prof. Pavlov has finally published the “methodology”1)Prof. Pavlov’s methodology he used to arrive at the conclusion that “City of Vancouver currently has the highest property taxes in Canada”. Before we examine the methodology, let’s get something out of the way: Prof. Pavlov’s conclusion that “City of Vancouver currently has the highest property taxes in Canada” is a lie.
In his “methodology” he admits that, while he makes the claim that “City of Vancouver currently has the highest property taxes in Canada,” his data is only for single family homes. The only conclusion that can be drawn from Prof. Pavlov’s “methodology” is “City of Vancouver currently has the highest property taxes in Canada if we only consider single family homes.”
Would that conclusion be any more truthful?
No. That’s also a lie.
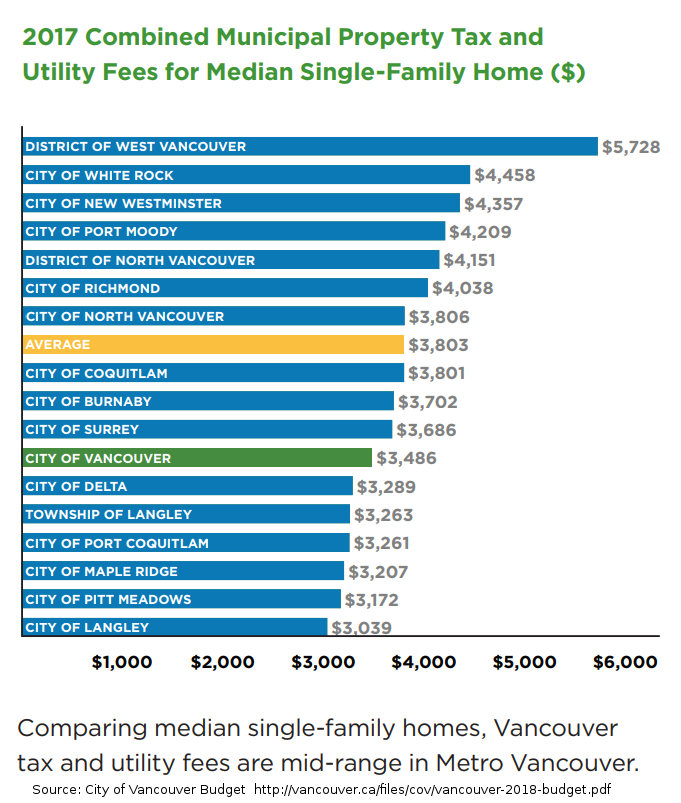
The City of Vancouver budget2)http://vancouver.ca/files/cov/vancouver-2018-budget.pdf shows that Vancouverites pay some of the lowest taxes even within the Lower Mainland. The A median single family home in Vancouver pays less tax and utilities than Surrey, Burnaby, New Westminster, Richmond and a whole host of other municipalities.
One would’ve expected a professor teaching at Simon Fraser University to be mildly curious about property taxes in Burnaby. But I digress.
Now let’s focus on Prof. Pavlov’s methodology. The good professor says “Using single-family homes is appropriate. About 80 percent of Canadian home owners live in single-family homes.”
Prof. Pavlov offers no source for his claim “About 80 percent of Canadian home owners live in single-family homes”. I did some digging, and the only statistics I can find about different dwelling types is from Statistics Canada. According to the 2011 census3)https://www.statcan.gc.ca/tables-tableaux/sum-som/l01/cst01/famil55a-eng.htm, there were 13,320,610 households in Canada, out which 7,329,150 are single family homes. That’s 55 percent. I have no idea how Prof. Pavlov went from 55 percent to 80 percent. Until Prof. Pavlov provides a reliable source for his data, I’m going to file that under Prof. Pavlov’s Alternative Facts.
Update 1
A kind reader has provided me with the exact numbers for owner occupied properties by dwelling types. In Canada, out of 9,541,320 owner-occupied dwellings in the 2016 census, 6,858,540 (71.8%) were Single-detached houses4)Structural Type of Dwelling (10), Tenure (4), Condominium Status (3), Household Size (8) and Number of Bedrooms (6) for Private Households of Canada, Provinces and Territories, Census Metropolitan Areas and Census Agglomerations, 2016 Census – 25% Sample Data . That’s definitely not “about 80 percent”. In Vancouver, out of 612,010 owner-occupied dwellings in the 2016 census, 249,850 (40.8%) were Single-detached houses5)Structural Type of Dwelling (10), Tenure (4), Condominium Status (3), Household Size (8) and Number of Bedrooms (6) for Private Households of Canada, Provinces and Territories, Census Metropolitan Areas and Census Agglomerations, 2016 Census – 25% Sample Data. So, if Prof. Pavlov is trying to show that “City of Vancouver currently has the highest property taxes in Canada,” he cannot conveniently ignore nearly 60 percent of the dwellings in the city.
End update
In conclusion, Prof. Pavlov’s original conclusion “City of Vancouver currently has the highest property taxes in Canada” is a lie. The only conclusion that can be derived from his “methodology”, that “City of Vancouver currently has the highest property taxes in Canada if we only consider single family homes,” is also a lie. The assertion of his methodology that “About 80 percent of Canadian home owners live in single-family homes.” has no basis in fact.
References
| 1. | ↑ | Prof. Pavlov’s methodology |
| 2. | ↑ | http://vancouver.ca/files/cov/vancouver-2018-budget.pdf |
| 3. | ↑ | https://www.statcan.gc.ca/tables-tableaux/sum-som/l01/cst01/famil55a-eng.htm |
| 4. | ↑ | Structural Type of Dwelling (10), Tenure (4), Condominium Status (3), Household Size (8) and Number of Bedrooms (6) for Private Households of Canada, Provinces and Territories, Census Metropolitan Areas and Census Agglomerations, 2016 Census – 25% Sample Data |
| 5. | ↑ | Structural Type of Dwelling (10), Tenure (4), Condominium Status (3), Household Size (8) and Number of Bedrooms (6) for Private Households of Canada, Provinces and Territories, Census Metropolitan Areas and Census Agglomerations, 2016 Census – 25% Sample Data |


As a SFU alum I feel horrified & disgusted. Can someone file a complain for academic dishonesty. Also if I recall for any papers or data points you need to provide reference points. Is the professor receiving any “grant” or consulting contract from RE industry?
Wow. For someone who is making such bold claims and so viciously and publicly attacking the personal integrity of a university professor Mr. Rezel, you sure do retreat a lot from your claims. First you say the the analysis is wrong because of its methodology. Then you abandon that after looking at the supporting data. Then you switch to saying that the conclusion that taxes are high is wrong because that only applies to detached homes (as if somehow Pavlov’s conclusion confirming this fact about detached homes makes it okay that taxes are in fact really high for those!). Then you seem to be trying to imply Pavlov is wrong (you actually call him a liar) because detached homes don’t matter. You base this on a statistic you found that they’re 55% of Canadian dwellings and not 80%, then you say you were wrong about that and amend it to 72% of Canadian dwellings so it’s now 72% versus 80%–such an obviously silly basis for your grave accusations of willful deceit. Now finally you have switched to disputing Professor Pavlov NOT about his analysis, which was about Vancouver compared to Calgary, Edmonton, Montreal, Ottawa, Regina, Saskatoon and Toronto, but about a different analysis which was not Professor Pavlov’s chart which you attacked so discourteously and as it now turns out, without basis. Perhaps time for you to apologize to Professor Pavlov?