Update II: Prof. Pavlov has finally published his materials and methods, almost a month after his graph was published. In the words of great scientist Carl Sagan “Extraordinary claims require extraordinary evidence”, and Prof. Pavlov’s original graph was an extraordinary claim with an extraordinary lack of evidence. But I’m happy that he has finally made his methodology public, and, as promised, I’m updating my post.
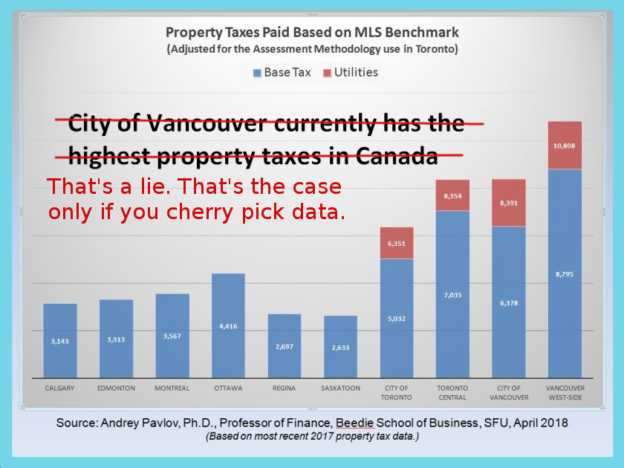
However, I stand by the statement that Prof. Pavlov’s claim “City of Vancouver currently has the highest property taxes in Canada” is a lie.
A graph produced by SFU Professor Andrey Pavlov that purports to show Vancouver as having the highest property taxes in Canada is doing the rounds on the Internet1)https://twitter.com/andrey_d_pavlov/status/996798250446286848. But as you can see from the tables below, Prof. Pavlov is comparing the property taxes for composite (all home types: detached, townhouses and condos) in Greater Toronto against the property taxes for single family homes in the City of Vancouver.
| City | Mill Rate from Altus (Pavlov’s Source) 2)Altus Group: Canadian Property Tax Rate Benchmark Report 2017 https://www.altusgroup.com/wp-content/uploads/2017/10/Canadian-Property-Tax-Rate-Benchmark-Report.pdf | Property Tax indicated in Pavlov’s graph | MLS Benchmark required to get Pavlov’s property tax figure |
| City of Toronto | 6.62 | 5,032 | $760,120.85 |
| City of Vancouver | 2.55 | 6,378 | $2,501,176.47 |
| Area | Composite MLS Benchmark | MLS Single Family Detached Benchmark | |
| City of Toronto | $830,500 | $1,109,700 | |
| Greater Toronto | $766,300 | $927,800 | |
| City of Vancouver (East) 3)CREA provides MLS Benchmark values for City of Vancouver, but REBGV East Vancouver and West Vancouver separately. | $1,114,000 | $1,544,100 | |
| City of Vancouver (West) 4)CREA provides MLS Benchmark values for City of Vancouver, but REBGV East Vancouver and West Vancouver separately. | $1,372,500 | $3,404,200 | |
| Greater Vancouver | $1,092,000 | $1,605,800 |
Not only is Prof Pavlov comparing apples to oranges, he is outright lying by passing off benchmark prices for Greater Toronto as ones for the City of Toronto.
Prof. Pavlov’s erroneous graph has been used as the basis for a Vancouver Sun article5)http://vancouversun.com/opinion/op-ed/elizabeth-murphy-b-c-taxes-need-a-second-look which, in turn is now being used by the opponent of BC NDP government’s housing reforms to attack those much needed reforms6)https://twitter.com/search?q=http%3A%2F%2Fvancouversun.com%2Fopinion%2Fop-ed%2Felizabeth-murphy-b-c-taxes-need-a-second-look&src=typd. Even the BC Liberals7)https://twitter.com/bcliberals/status/1000852543705006080 are tweeting Prof. Pavlov’s mendacious graph.
In the era of fake news, the public look up to academia in their search for truth. I find it disturbing and unacceptable that Prof. Pavlov has chosen to disseminate false information. Prof. Pavlov’s steadfast refusal to offer an apology and issue a correction even after being called8)https://mobile.twitter.com/1alexhemingway/status/1000246334975131648 out on his falsehoods further seek to not only diminish the credibility of Simon Fraser University, but it also undermines people’s trust in academia as a whole.
Update: Alex Hemingway, whom I cited earlier in the article, has kindly informed me that depending on how Prof. Pavlov calculated the Toronto four year average “current assessed value”, the figures used in the graph may indeed be for single family homes. Based on data obtained from sources Prof. Pavlov has mentioned, I’m unable to reproduce the good professor’s math.
If Prof. Pavlov were to reveal his materials and methods, I will be happy to update my post.
Even if Prof. Pavlov were doing an apples to apples comparison, his “City of Vancouver currently has the highest property taxes in Canada” graph is still a lie, as he does not mention anywhere on the graph that he is only using single family home benchmark values in his calculations. Even if all his numbers are correct, all that his graph shows is that “City of Vancouver may have the highest property taxes in Canada if you only consider the most expensive segment of the market.”
References
| 1. | ↑ | https://twitter.com/andrey_d_pavlov/status/996798250446286848 |
| 2. | ↑ | Altus Group: Canadian Property Tax Rate Benchmark Report 2017 https://www.altusgroup.com/wp-content/uploads/2017/10/Canadian-Property-Tax-Rate-Benchmark-Report.pdf |
| 3, 4. | ↑ | CREA provides MLS Benchmark values for City of Vancouver, but REBGV East Vancouver and West Vancouver separately. |
| 5. | ↑ | http://vancouversun.com/opinion/op-ed/elizabeth-murphy-b-c-taxes-need-a-second-look |
| 6. | ↑ | https://twitter.com/search?q=http%3A%2F%2Fvancouversun.com%2Fopinion%2Fop-ed%2Felizabeth-murphy-b-c-taxes-need-a-second-look&src=typd |
| 7. | ↑ | https://twitter.com/bcliberals/status/1000852543705006080 |
| 8. | ↑ | https://mobile.twitter.com/1alexhemingway/status/1000246334975131648 |
small nitpick, there’s a typo on the 2nd to last paragraph I think you meant erroneous rather than errenuous
Thanks! Fixed.
Did you do a graph then with the correct data to see how it does compare?
It doesn’t change the underlying data. Rezel did not account for Professor Pavlov’s adjustment re: Toronto’s 4 year averaging and phase-in formula, which substantially reduces Toronto’s assessed values that are applicable to property tax.
Vancouverites are still paying the highest property taxes in Canada.
According to this calculator I would be paying significantly more taxes for my house if I lived in Toronto: https://www.toronto.ca/services-payments/property-taxes-utilities/property-tax/property-tax-calculator/property-tax-calculator/
That’s not how you compare. Houses are more here so you have to compare identical houses, not base it on the assessed value. That’s why we have a mill rate, otherwise the tax would be based on assessed value, but it is not.
Rohana Rezel: You admit in your “update” towards the end of your post above that the claims you make are not true. Why haven’t you removed your post with the false claims? You claimed that Professor Pavlov is using different benchmarks across cities. Then you corrected that at the bottom of your post, but you did not change your inaccurate and misleading markup of Professor Pavlov’s graph, or remove your incorrect statement. Andrey Pavlov’s numbers are true.
If you read closer, you’ll see that a) the author has not been able to confirm Doctor Pavlov’s math and b) Pavlov is using only detached, single family homes.
Omitting the subject of his calculations is a lie of omission, but the real crime here is that atrocious chart.
It does not have labels or units, I’m going to assume the figure in the read cap is the sum total, as opposed to the utilities total, and the chart does not include the relative benchmarks being used in the various cities. He should be embarrassed by this “work,” so should SFU, and I feel really sorry for anyone who thinks they’re getting an education from this clown.
Here’s a gem of a quote from the good professor, speaking to a room of angry West Van home owners who were aghast at having to pay an extra $5k/ year on a $4.5m home:
Pavlov suggested that overall tax increases are hurting affordability.
“If you’re a buyer, the fact that the home price is cheaper does nothing to help you.”
I always thought that lower prices were good for buyers, but I’m not a “Professor of finance and real estate,” at SFU so it’s probably way over my head.
http://www.nsnews.com/news/west-vancouverites-revolt-as-school-tax-looms-1.23330273
Hi Braden,
You have share a great information on this page about the removal of property tax due to the highest country tax in city in a most easiest way by writing an application with the specific reason to the government of Canada wand also attachment of legal property documents which is helpful for your property tax layer to pass you property tax claim with in a short period of time according to the rules and regulation of a country policy .
Thanks .