Simon Fraser University Professor Andrey Pavlov recently produced a graph with the bold claim that “City of Vancouver currently has the highest property taxes in Canada”. The graph is based on multiplying MLS Detached Benchmark prices by the tax rate1)Prof. Pavlov’s methodology.
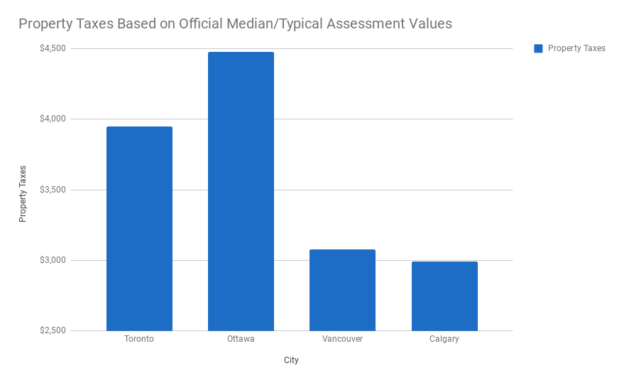
Cities don’t use MLS Detached Benchmark prices to calculate property taxes. Cities use assessed values from official assessment bodies. I spent the evening digging up the official assessment values for some of the cities in Prof. Pavlov’s graph. And here’s my graph.
My conclusion, based on official published data, is that Prof Pavlov’s claim “City of Vancouver currently has the highest property taxes in Canada” is inaccurate.
Here’s my math.
| City | Reported Metric | 2017 Assessment | Property Tax Rate | Property Taxes |
| Toronto | Typical | $596,750 | 6.62 | $3,950 |
| Ottawa | Typical | $419,363 | 10.68 | $4,479 |
| Vancouver | Median | $1,207,000 | 2.55 | $3,078 |
| Calgary | Median | $460,000 | 6.5 | $2,990 |
| Ease in Calculations | 2012 | 2016 | 2017 Phase-in |
| Toronto | $539,000 | $770,000 | $596,750 |
| Ottawa | $415,484 | $431,000 | $419,363 |
Here are my sources of data.
| Toronto | MPAC |
| Ottawa | MPAC |
| Vancouver | |
| Calgary | City of Calgary |
| Property Tax Rates | Altus Group |
References

Why would you use the ‘typical’ metric for Toronto/Ottawa and ‘median’ for Vancouver/Calgary, without making any adjustments for the difference?